Visualization
DI-drive builds an online visualizer for the user to check the situation of a running simulator and save gif/video files. The
visualizer is added in the environment’s render. When calling this method, if
a visualizer is created by config settings, it will take a sensor data as canvas and put some info text onto it, including
actions, road options, agent state, reward, traffic light records and so on. Then
the canvas can be showed in the screen or saved as a gif or video file to watch.
A visualizer can be customized by config.
visualizer = dict(
    type=None,
    show_text=True,
    outputs=list(),
    save_dir='',
    frame_skip=0,
)
- type
The observation tag in simulator config’s
obskey. Visualizer use it as a canvas image.
- show_text
Whether to add text above the image. Text information is found in observation or action dict.
- outputs
Output types of visualizer, can be one or more items of [‘show’, ‘gif’, ‘video’]
- save_dir
Folder path to save visualized files.
- frame_skip
The number of frames skipped between two steps when visualizing. For example, if set to 2, the painting and showing will be run every 3 frames.
Here we show some visualization results. You can check how to get these visualizations in auto run
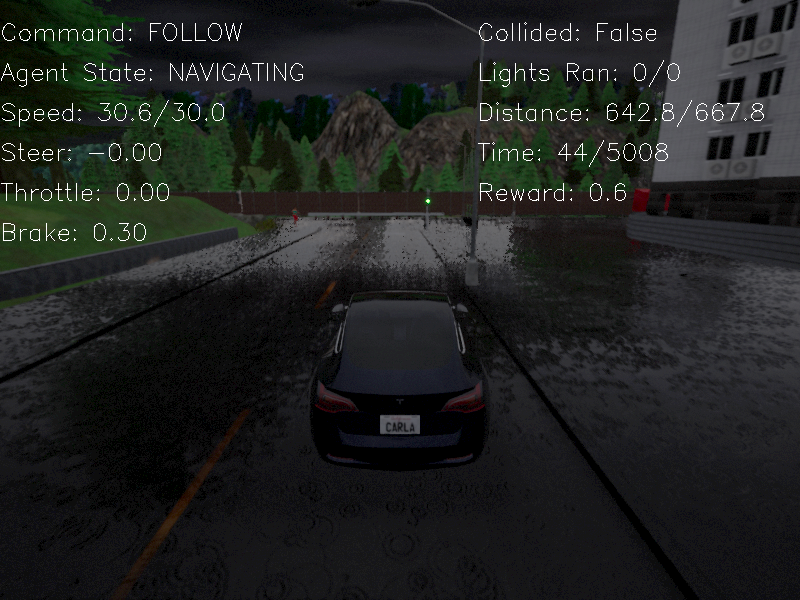
Visualization of RGB camera
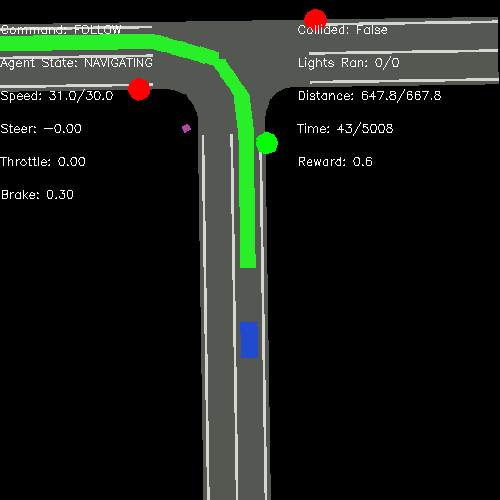
Visualization of Bird-eye View image
There is also another visualization method using gym.wrappers.Monitor to record the visualized
canvas returned by render method of an environment, and make video using ffmpeg lib.
This can be switched on by calling enable_save_replay of an env manager. The visualization
video and logs will be recorded in the provided folder path.
my_env = BaseEnvManager(env_fn, cfg.enb.manager)
my_env.enable_save_replay(cfg.env.replay_path)
Note
If you are using your own env class, be careful dealing with env instance when using visualization with ‘enable_save_replay’.