Auto policy running and visualization
DI-drive provides an AutoPIDPolicy which can navigate through
a target waypoint and command in observation. It can be used for data sampling, map and sensor data
visualization, reward design, etc.
To quickly run the demo, start a Carla server first. Then you can connect to the server and run policy.
Running with start and target waypoint
In this part, the policy runs in SimpleCarlaEnv.
It follows a route calculated by provided start and end waypoint index when calling reset method.
Simply run the following command. You may need to change the Carla server host and port in auto_run.py
first.
cd ./demo/auto_run
python auto_run.py
autorun_config = dict(
    env=dict(
        ...
    ),
    server=[
        dict(carla_host='localhost', carla_ports=[9000, 9002, 2])
    ],
    policy=dict(...),
)
Running with scenario in Casezoo
In this part, the policy runs in ScenarioCarlaEnv.
It runs with provided Casezoo route and config file, or the single scenario name.
Check Casezoo instruction for all scenario name and description in Casezoo.
Simply run the following command.
cd ./demo/auto_run
python auto_run_case.py --host <your Carla server host> --port <your Carla server port> \
# Running route with scenario
--route <route .xml file> <route .json config file>
# Running single scenario
--scenario <scenario name>
Visualization
We provide two default sensor data to visualize. You can switch the shown image in visualizer by change the ‘type’ key in the visualize config. The sensor config can be change them whatever you want.
autorun_config = dict(
    env=dict(
        simulator=dict(
            ...
            obs=(
                dict(
                    name='rgb',
                    type='rgb',
                    size=[800, 600],
                    position=[-5.5, 0, 2.8],
                    rotation=[-15, 0, 0],
                ),
                dict(
                    name='birdview',
                    type='bev',
                    size=[500, 500],
                    pixels_per_meter=8,
                ),
            ),
        ),
        visualize=dict(
            type='birdview',
            outputs=['show']
        ),
    ),
    ...
)
If everything works well you can see running screen like this.
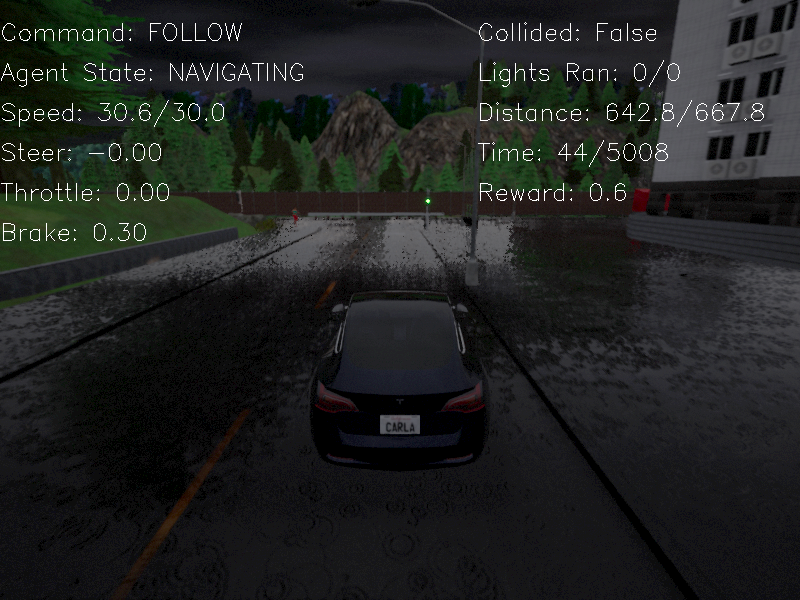
Visualization of RGB camera
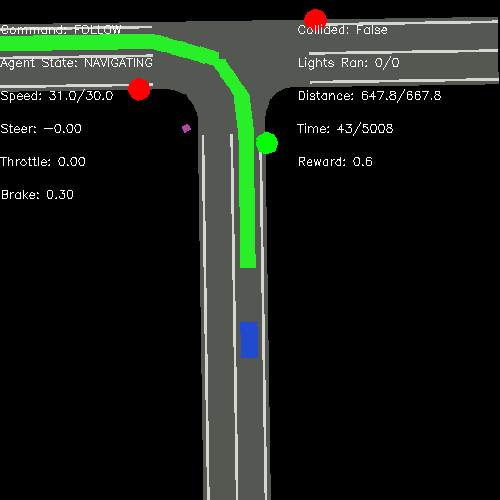
Visualization of Bird-eye View image